Visualization Tool
Visualize the results with tensorboardX. To import the tool:
from parl.utils import summary
add_scalar
summary.add_scalar(tag, scalar_value, global_step=None)
Common used arguments:
- tag (string) – Data identifier
- scalar_value (float or string/blobname) – Value to save
- global_step (int) – Global step value to record
Example:
from parl.utils import summary
x = range(100)
for i in x:
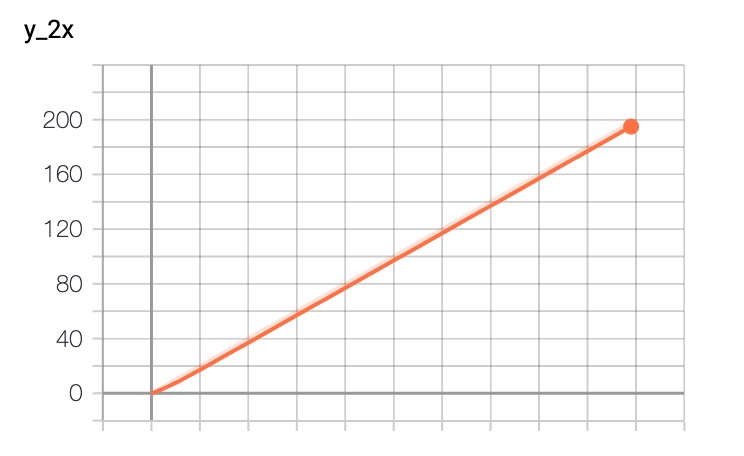
summary.add_scalar('y=2x', i * 2, i)
Expected result:
add_histogram
summary.add_histogram(tag, values, global_step=None)
Common used arguments:
- tag (string) – Data identifier
- values (torch.Tensor, numpy.array, or string/blobname) – Values to build histogram
- global_step (int) – Global step value to record
Example:
from parl.utils import summary
import numpy as np
for i in range(10):
x = np.random.random(1000)
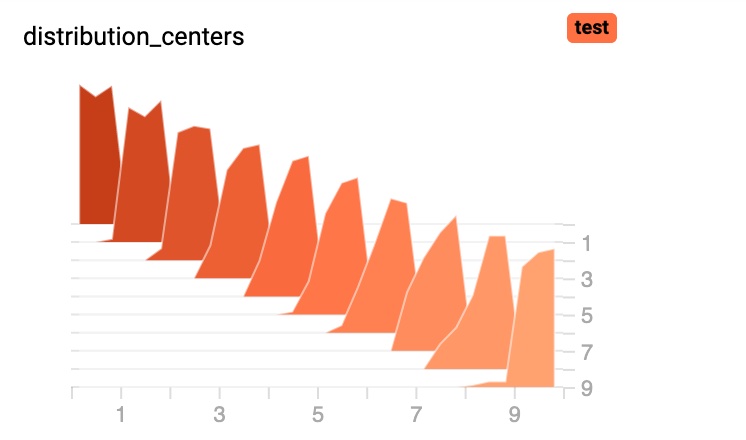
summary.add_histogram('distribution centers', x + i, i)
Expected result:
Modify Default Saving Path
The default summary saving path is ./train_log, the summary output path binds to logger path, so we only need to modify the logger path:
from parl.utils import logger
logger.set_dir('./train_log/exp1')